5 minutes
Measuring an eBPF Cache Without Leaving the Kernel
When testing our eBPF agent, I don’t always get the same experience as our users, especially in performance critical sections. I realize that the benchmark test suite isn’t always enough, because user’s environments can be completely different from our benchmarks.
I recently implemented a perf feature, which was inode caching for file access policies, and wanted to understand how it is being used in the users’ environments based on their workloads. I wanted to proactively gather insights about the cache, including cache hits and misses, so I built metrics to measure the feature.
My goal was to gather eBPF metrics based on the user’s usage and quickly answer questions about why things are slow (improve MTTR). To do this, I wanted:
- Record perf/usage counters at the kernel to show how that particular feature is being used.
- Performance is essential, as our metrics collection will be at the kernel.
- So I cannot use ring buffers for sending messages from kernel to userspace for the above-mentioned counters.
- I didn’t want any spin locks or shared maps, or even LRU caches.
- I wanted metrics collection to be “on” always for obvious reasons.
- I wanted the metrics to be a rolling window instead of a counter (more on this later).
The Data Structure
- A per CPU map for storing metrics (to avoid locks on the hot path)
- The
inode_cache_statsstruct, - And a one entry array holding the epoch.
The per CPU map stores the inode_cache_stats, which avoids locking and the perf penalty. But this comes with a downside: userspace has to aggregate metrics from multiple maps, as each CPU has its own map, which in turn has its own store of inode_cache_stats. I run a timer from userspace to collect and aggregate this data. I understand that when there are no locks, the scrape can land in between increments and counts will be approximate, which is fine for ratios.
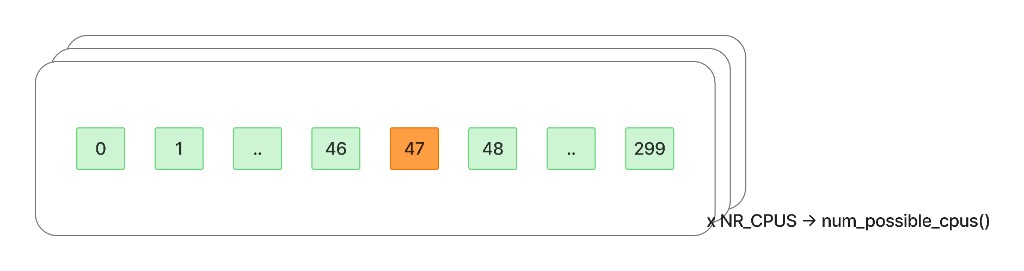
One array of 300 slots per CPU
I store the epoch timestamp from the very first time in the array that every CPU shares, and there aren’t using any sleepable hooks lsm.s/
#define BUCKET_WIDTH_NS 1000000000ULL  // 1 second buckets
#define MAX_BUCKETS 300                // 300 seconds = 5 minutes

struct inode_cache_stats {
    __u64 abs_bucket;
    __u64 lookups;
    __u64 hits_no_policy;
    __u64 hits_allow;
    __u64 hits_deny;
    __u64 misses_walk;
    __u64 fills;
};
In inode_cache_stats, every field is a counter except abs_bucket.
now        = bpf_ktime_get_ns()
abs_bucket = (now - epoch) / BUCKET_WIDTH_NS
slot       = abs_bucket % MAX_BUCKETS
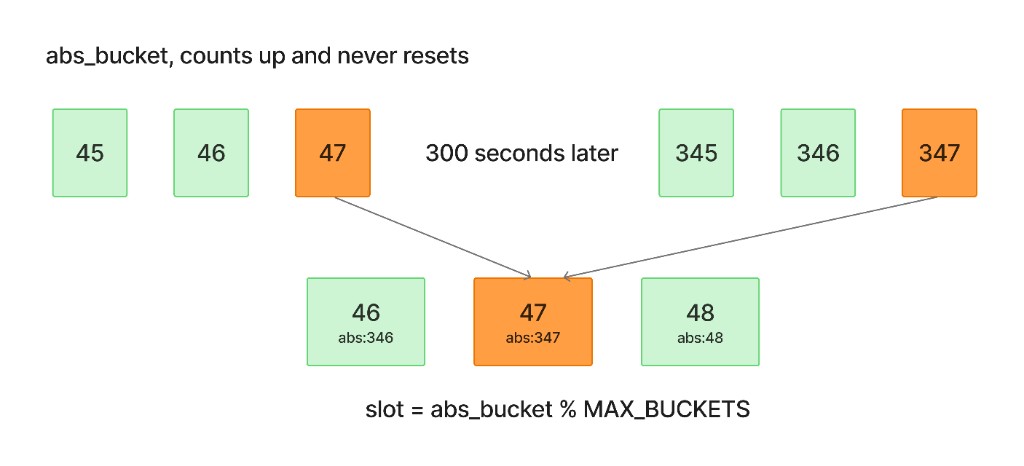
Two seconds, five minutes apart, same slot
The abs_bucket is an absolute bucket number since epoch, and I use it to calculate the slot. For example, if abs_bucket is either 347 or 547, it will land in slot 47.
Every slot in the map will be 56 bytes, and there are 300 slots per CPU. On a 16-CPU box, the whole thing is about 270 KB of kernel memory, which IMO is good for the value it adds.
What I am building is my own version of the RRDtool https://en.wikipedia.org/wiki/RRDtool.
Here is our increment counter, which increments the values in inode_cache_stats, and this will be invoked wherever the cache is being used, like fetching, hits, etc.
void stats_inc(u32 counter)
{
    u64 now        = ktime();
    u64 abs_bucket = (now - epoch) / BUCKET_WIDTH_NS;
    u32 slot       = abs_bucket % MAX_BUCKETS;

    struct inode_cache_stats *b = &stats_map[slot]; // per CPU map

    if (b->abs_bucket != abs_bucket) {
        memset(b, 0, sizeof(*b));
        b->abs_bucket = abs_bucket;
    }

    switch (counter) {
        case CACHE_STATS_LOOKUPS:        b->lookups++; break;
        case CACHE_STATS_HITS_NO_POLICY: b->hits_no_policy++; break;
        case CACHE_STATS_HITS_ALLOW:     b->hits_allow++; break;
        case CACHE_STATS_HITS_DENY:      b->hits_deny++; break;
        case CACHE_STATS_MISSES_WALK:    b->misses_walk++; break;
        case CACHE_STATS_FILLS:          b->fills++; break;
    }
}
Results
Here are the results from our test suite, where I opened the same file in a loop, and the VM was doing its normal work at the same time, so not every lookup was because of our test suite.
With the data available as a map globally (yes, I am aware of the threat vector where anyone with escalated privileges can manipulate the map), I can scrape the map data and calculate the summary. In this example, I am using bpftool and some python scripting.
➜ main ✗ % sudo bpftool -j map dump id 17238 | python3 -c '
import json,sys
keys=["lookups","hits_no_policy","hits_allow","hits_deny","misses_walk","fills"]
tot={k:0 for k in keys}
for e in json.load(sys.stdin):
    for cpu in e["values"]:
        b=bytes(int(x,16) for x in cpu["value"])
        for k,n in zip(keys,[int.from_bytes(b[i:i+8],"little") for i in range(8,56,8)]):
            tot[k]+=n
print(json.dumps(tot, indent=2))
lookups=tot["lookups"]
hits=tot["hits_no_policy"]+tot["hits_allow"]+tot["hits_deny"]
print("hit_rate", round(hits/lookups, 4) if lookups else None)
'
Results after our test suite run.
{
  "lookups": 466908,
  "hits_no_policy": 462005,
  "hits_allow": 610,
  "hits_deny": 0,
  "misses_walk": 4293,
  "fills": 4293
}
From the above result
lookups: This was466,908lookups for the cache.hits_no_policy:462,005; this was the number of cache hits where I didn’t have a file access policy. So the code could exit early and avoid walking up the stack, since I had already done it once.hits_allow:610times, I found a cached entry with a rule and allowed access.hits_deny: I didn’t have any denies, which is expected as our test suite didn’t include a policy that would trigger any denies.misses_walk: The code had to walk up the stack to construct the path and then check the policy if access to these was allowed.fills: Fills are when the code fills the cache after walking up the stack to construct the path and evaluating the file access policy.- The lookups math works:
462,005(hits_no_policy) + 610 (hits_allow) + 0 (hits_deny) + 4,293 (misses_walk) = 466,908.
During the run, the number of distinct inodes that were accessed was 4,293, and for each one of these, the code walked up the stack to construct the path exactly once to evaluate the file access policy,
I was surprised by the high number of hits_no_policy, which makes sense as the system will have other file opens.
This idea is not specific to the inode cache metric, but can be used for other features to understand usage in user’s environments and also, in this post, I am not diving into inode caching.